Earthquake Statistics: How often do Earthquakes Occur?
- about 3.5 Mio earthquake/year worldwide (Table 5.5)
- majority of EQ are very small; large EQ are rare!
- e.g. 3 Mio mag. 1 EQ/year vs. 0.3 mag. 8.5 EQ
- this means that, to see all number in a graph, the numbers have to be plotted on a logarithmic scale, not on a linear scale. On a linear scale, the small large earthquakes don't show up
- get recurrence rate of EQ of certain magnitude from number of EQ/year
- e.g. there are 210 mag. 6.0-6.5 EQs per year globally; so an EQ of this magnitude occurs every 1/210 years = 0.00476 years, or 1.74 days (0.00476*365)
- => a magnitude 0.0=1.9 EQ happens every 10.5s; a mag 8.5 or larger EQ happens only every 3.3 years
- EQs do not occur regularly (i.e. time interval between EQ is not regular)
- the recurrence time of an EQ of a certain magnitude has a certain probability
- scientists use these probabilities to forecast the chance for an EQ along a fault; e.g. the probability of a magnitude 7 EQ to happen before 2032 is greater than 30% in many places along SAF, including southern CA
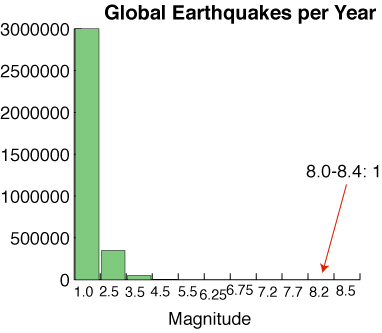 linear scale
 log scale
 |
|
|
example for seismicity for 1 week in Southern California 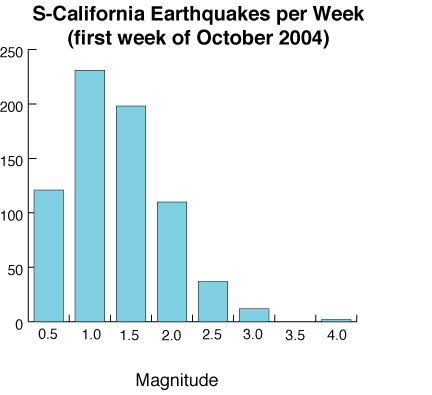
|
|
Earthquake Physics: Stress and Strain
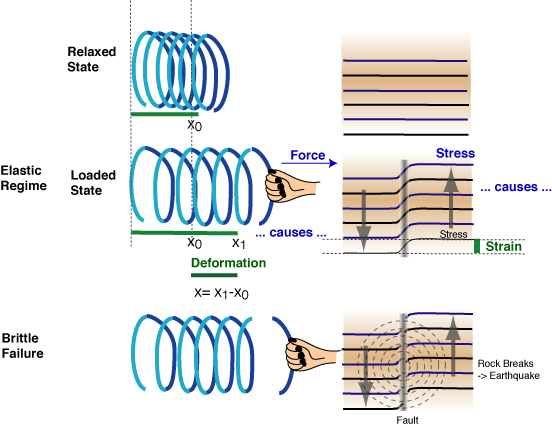 enlarge |
|
Earthquake Physics: Asperities and Friction
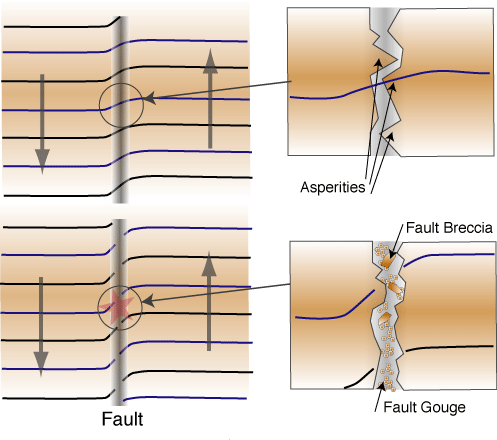 enlarge |
|
Earthquake Physics: Stick-Slip Behavior
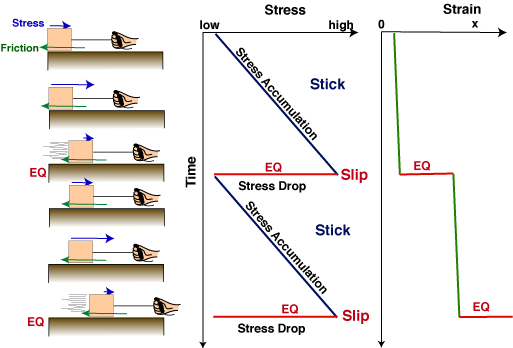 enlarge |
|
Different Types of Seismic Waves
- P Waves
- primary waves; first to arrive at a seismic station
- compressional waves
- a type of seismic wave that travels straight through Earth from EQ to station (body wave)
- particle motion in the direction of wave propagation
- somewhat equivalent to sound waves (acoustic waves)
- S Waves
- secondary waves; second to arrive at a seismic station
- shear waves
- a type of seismic wave that travels straight through Earth from EQ to station (body wave)
- particle motion perpendicular to the direction of wave propagation
- equivalent to waves on a string or electromagnetic waves (e.g. light waves)
- Love Waves
- a type of seismic wave that travels along the Earth surface between EQ and station (surface wave)
- superposition of multiply reflecting shear waves
- slower than shear waves
- particle motion perpendicular to the direction of wave propagation
- particle motion decreases exponentially with depth
- equivalent to waves in a wheat field when a passing car causes spikes to sway
- Rayleigh Waves
- a type of seismic wave that travels along the Earth surface between EQ and station (surface wave)
- complicated superposition of multiply reflecting body waves
- typically slower than Love waves
- retrograde elliptical particle motion (orbits against propagation direction)
- particle motion decreases exponentially with depth
- equivalent to water waves except that particle motion of water waves is prograde and circular
- typically the longest phase with the highest amplitudes -> most damaging ground motion
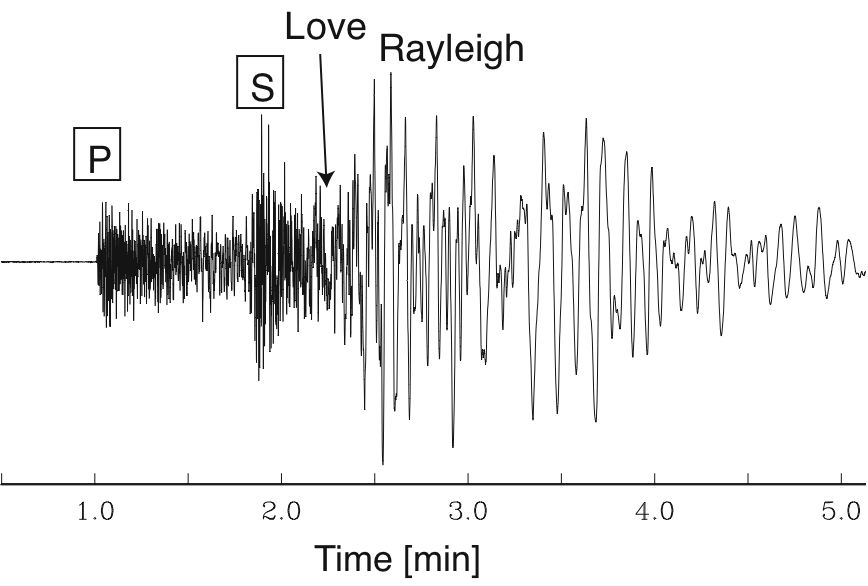
The Phases in a Seismogram
NB: the seismogram above is a vertical-component seismogram. The arrival time of the Love wave is indicated but there is actually hardly any signal. Since Love waves consist of purely horizontal motion, a horizontal seismometer is needed to record that motion. A full seismic record consists of 3 seismograms that record the vertical motion as well as that in the North-South direction and the East-West direction. The whole record, consisting of 3 seismograms, is then called a 3-component record.
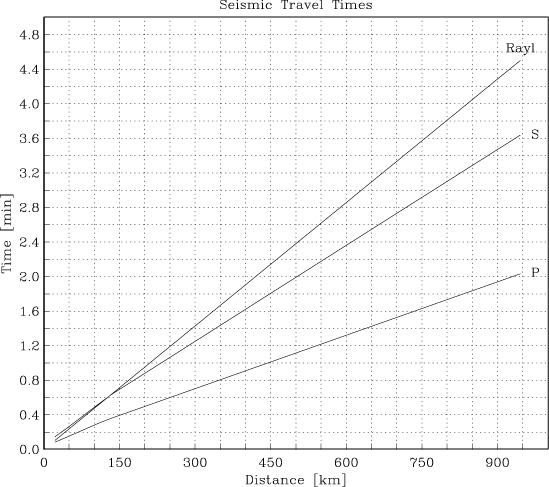
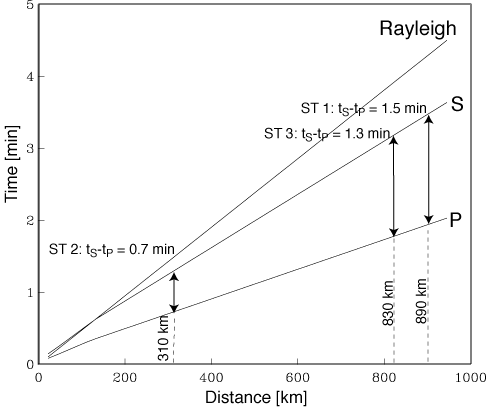
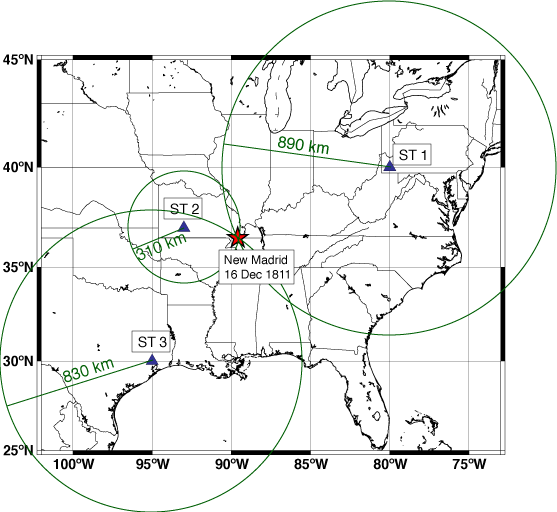
Locating an Earthquake
- need at least 3 seismograms/stations to find epicenter
- need at least 4 seismograms/stations to find hypocenter
(one additional station is needed to find one additional parameter, the source depth)
NB: to determine the hypocenter, one would have to draw spheres around 4 stations. The point at which the 4 spheres intersect is the hypocenter. In practice, this is, of course, not drawn on paper but calculated on a computer.
Earthquake Prediction: The Case Parkfield
- prior to 2004, Parkfield had a 90% chance for a mag. 6 EQ occurring before 2032
- segment located between ruptured segments of S.F. 1906 EQ to north and Fort Tejon 1857 EQ to south
- 6 large EQ between 1857 and 1966; almost regularly 1 EQ every 22 years
- next EQ predicted for window between 1975 and 1993
- seismologists deployed instruments in Parkfield
- EQ did not happen until Sept. 28, 2004
- Question: was EQ#7 11 years late (case 1) or did #7 never happen and EQ #8 was right at beginning of predicted time window (case 2)
- reason for case 1: unknown
- reason for case 2: unknown why #7 did not happen, but San Simeon EQ (Dec 22, 2003) on fault to west, parallel to SAF increased stress on SAF, perhaps making #8 more likely to happen
- last EQ puzzles seismologists because rupture propagated south, not north as most other EQ did
Long-term Earthquake prediction
- extremely difficult (see Parkfield)
- each fault system is unique, has different characteristics
- use past seismic records (historic and instrumental) to obtain recurrence time of certain magnitude
- use paleoseismology/trench work where seismic records are sparse (e.g. San Diego) (Fig. 5.19/4th 4.21)
- some faults are hidden beneath unperturbed sediments (blind fault) and only discovered after an EQ (e.g. the fault that ruptured in the 1994 Northridge in L.A. was previously unknown)
Short-term Earthquake prediction (seismic)
- also very difficult
- seismometers, which are designed to record motion during an earthquake, cannot record what happens between earthquakes
- use GPS and laser strain meter to determine continuous movement along fault, also at aseismic times (time when no EQ happens); advantage: continuous data; disadvantage: only spot measurements where instruments are deployed
- determine stress pattern after EQ: rupture on one fault can change stress level on nearby fault (e.g. San Simeon Dec 22, 2003 EQ may have made Parkfield Sep 28, 2004 EQ more likely)
- How much is aseismic (creep, no EQ)?
- Is there significant increase in strain rate just before EQ?
- How long before an EQ?
- studies still in its infancy
Unlikely Prediction Tools (Extremely questionable!!)
- comets (unless they actually hit the ground)
- alignment of planets (if Earth tides don't work, planets don't work!!!)
- weather (hurricanes may influence volcanic eruptions but no influence found for EQ!)
- stock market (yeah, right!)
- grandma's arthritis (probably more weather related)
Earthquake Hazard Mitigation: What Scientists can do
- (seismic) monitoring (also GPS, possibly EM, ground water table in wells)
- Tsunami warning system
- educate residents how to prepare and react; see EQ Safety Booklet published by Southern California Earthquake Center (SCEC), USGS and others
- recommend building codes
- develop effective ways to build EQ-safe structures and retrofit existing structures (e.g. external braces for high-rise buildings; ball bearings for footing of bridges and freeway overpasses)
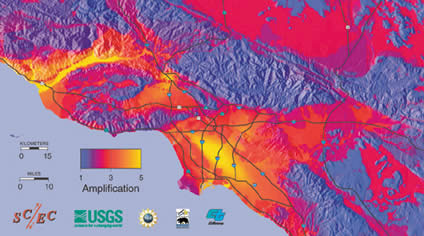 |
site amplification maps: get info on local geology and predict how local (thick) sediments enhance shaking (e.g. L.A. Sedimentary Basin vs. hard-lava-rock volcanic islands of Hawaii) |
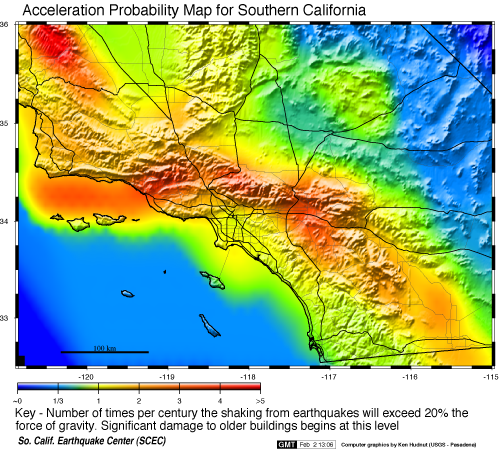 |
make shake probability maps: get info on fault type and geometry, seismicity patterns and calculate probability of of shaking of certain strength |
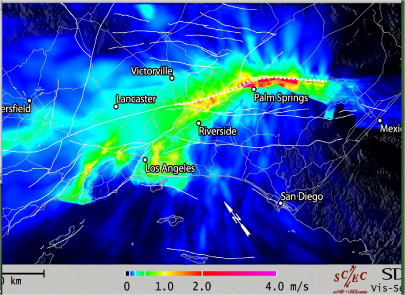 TERASHAKE still image |
TERASHAKE: A large group of scientists affiliated with SCEC have recently collected
all know information on earthquakes in southern California, such as faults, seismicity and local geology. Together with colleagues at the San Diego Supercomputer Center, they created a simulation of what would happen if the "Big One" on the southern end of the SAF would occur. The simulation predicts that, if the rupture of a magnitude 8 earthquake would start at the southern end and then propagate northward, then the seismic energy would be handed over onto neighboring faults that reach into the Los Angeles basin and cause major shaking there. NB: As of 10/15/18, the links to the original Terashake movies at SCEC (Southern California Earthquake Center) no longer exist, about 14 years after they were made. We provide a converted quicktime movie here on our own repository. |
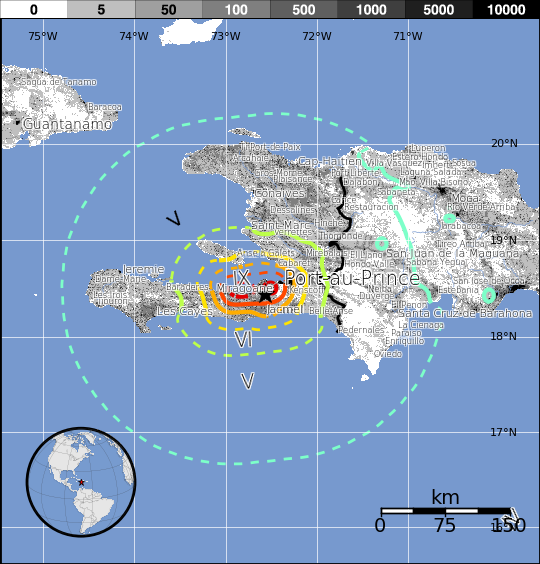 PAGER population exposure map for 2010 Haiti EQ |
immediately after an earthquake, determine (preliminary) fast-response shake maps, depending on population densities and direct relief teams to likely worst-hit areas; this is a relatively new program by the U.S. Geological Service called PAGER (Prompt Assessment of Global Earthquakes for Response). Check it out |
Earthquake Hazard Mitigation: What Governments can do
- control building in hazardous area
- establish building codes
(hard to enforce in less developed countries) - construct lifelines according to building codes
(e.g. re-enforced bridges)
(hard to enforce in less developed countries) - secure life lines/make disaster plans
- provide funding for disaster prevention and relief
- provide agencies to coordinate disaster prevention and relief (e.g. FEMA) and early warning (e.g. USGS and Pacific Tsunami Warning Center)
Earthquake Hazard Mitigation: What we can do
- don't build in hazardous area
- build structures according to code
(e.g. use flexible wood frames, not bricks-and-mortar technology) - construct lifelines to earthquake building codes
- landscaping and grading according to code (reduce landslide risk!)
- make disaster plans with family and/or friends/colleagues and/or employer
- have an emergency preparedness kit:
- first aid kit
- three-day survival kit including drinking water (1 gallon per person per day) and ready-to-eat canned food; dried fruit/food/juices; high-energy (granola bars) and comfort food;
- pet food; pet carrier
- medication
- extra clothing
- toiletry (e.g. toothbrush, toothpaste, soap, toilet paper, personal hygiene items and the like)
- flashlight and spare batteries; spare cellphone battery
- battery-operated radio and spare batteries; listen to KOKO/AM 600
- cash
- copies of essential paperwork (ID's, insurance policies etc.)
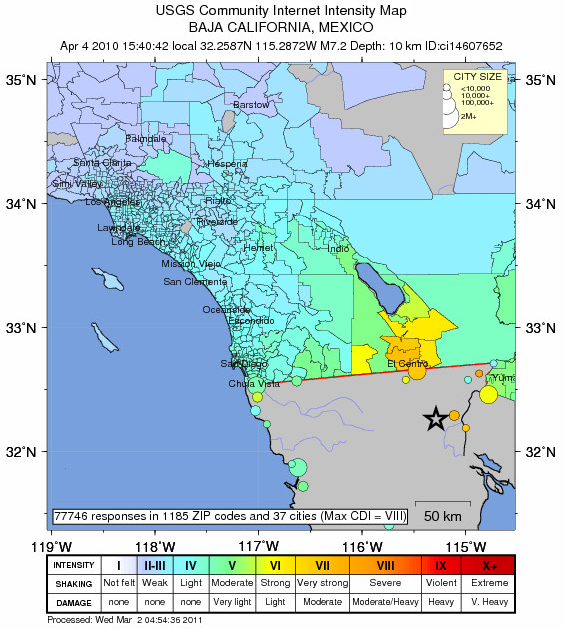 "did-you-feel-it" 4 Apr 2010 El Mayor EQ |
|
Recommended Reading
- "Earthquakes" by Bruce A. Bolt; ISBN: 0-7167-7548-4; price at amazon: $44.04. This book describes the basics of earthquakes, earthquake hazards and gives plenty of examples and historical accounts. This should be an easy read for anybody interested in earthquakes and earthquake research.
- "Earthshaking science" by Susan E. Hough; ISBN: 0-691-11819-1; price at amazon: $25.94. Also an introductory book on earthquakes but concentrates more on earthquake science and is a bit more specialized toward seismology.
